Using SonarQube for static code analysis
SonarQube is a popular tool for static code analysis that integrates with many technologies and services including .NET and GitHub. It is based on the Clean Code concept and applies a bank of language-specific rules to check code for poor quality such as violation of Clean Code conventions, syntax errors and code smells.
In a production environment, SonarQube is installed on a central server and incurs a licence fee. However, a free community version can be installed and run locally. It is distributed as a standalone executable, so no installation is required. Running the executable starts a local web server that provides a dashboard for configuration and viewing the results of an analysis. Setting up integration with GitHub provides access to all the project metadata including information about different branches. On the local computer, a .NET tool provides the integration with SonarQube so that an analysis is run automatically when the code is built.
Note
SonarQube integrates with the local .NET installation and not with VSCode. You will not see any commands related to SonarQube on the VSCode command palette. Instead, you need to use some CLI commands to ensure your build is analysed.
1. Install and run SonarQube
In this step, we will download the community version of SonarQube, run the local web server and access the dashboard.
-
Download the community version of SonarQube.
-
Unzip the distribution file to an appropriate directory.
For example, this could be the
/optdirectory on Mac or Linux, orC:\on Windows. -
Add the SonarQube executable directory to your PATH.
On Windows, use the System Settings dialog to add the directory
C:\sonarqube\bin\windows-x86-64to your PATH. Adjust the path if necessary depending on where you have installed the application.On other operating systems, update your shell initialisation file to add the appropriate directory to your PATH. On Mac, this is probably the
~/.zshrcfile and on Linux, the~/.bashrcfile. In both cases, add a comment followed by the required update command. Both forms of the command are shown in the following snippet. Check that the name of yoursonarqubedirectory matches the one shown.1 2 3
# Add SonarQube executable directory to the PATH export PATH="$PATH:/opt/sonarqube-10.6.0.92116/bin/macosx-universal-64" export PATH="$PATH:/opt/sonarqube-10.6.0.92116/bin/linux-x86-64"
Note that for any operating system, the changes will only apply to a new shell. On Mac and Linux you can apply the changes to the current shell by executing the update command at the command prompt.
-
Start SonarQube by executing the appropriate command at a command prompt.
On Windows, the command is
1
StartSonar.bat start
On Mac and Linux, the command is
1
sonar.sh start
-
Login to SonarQube.
By default, the bundled web server listens on port 9000. You can therefore access SonarQube by navigating to
http://localhost 9000in a browser.The default username/password is admin/admin. You will be prompted to change the password on the first login.
Because you have no projects at this stage, you are prompted to create a new project either by creating one locally or by importing a project from a DevOps platform such as GitHub. You should choose the GitHub option as shown in Fig. 1. There are some other steps to complete before you can fill in the required information in the configuration creation dialog.
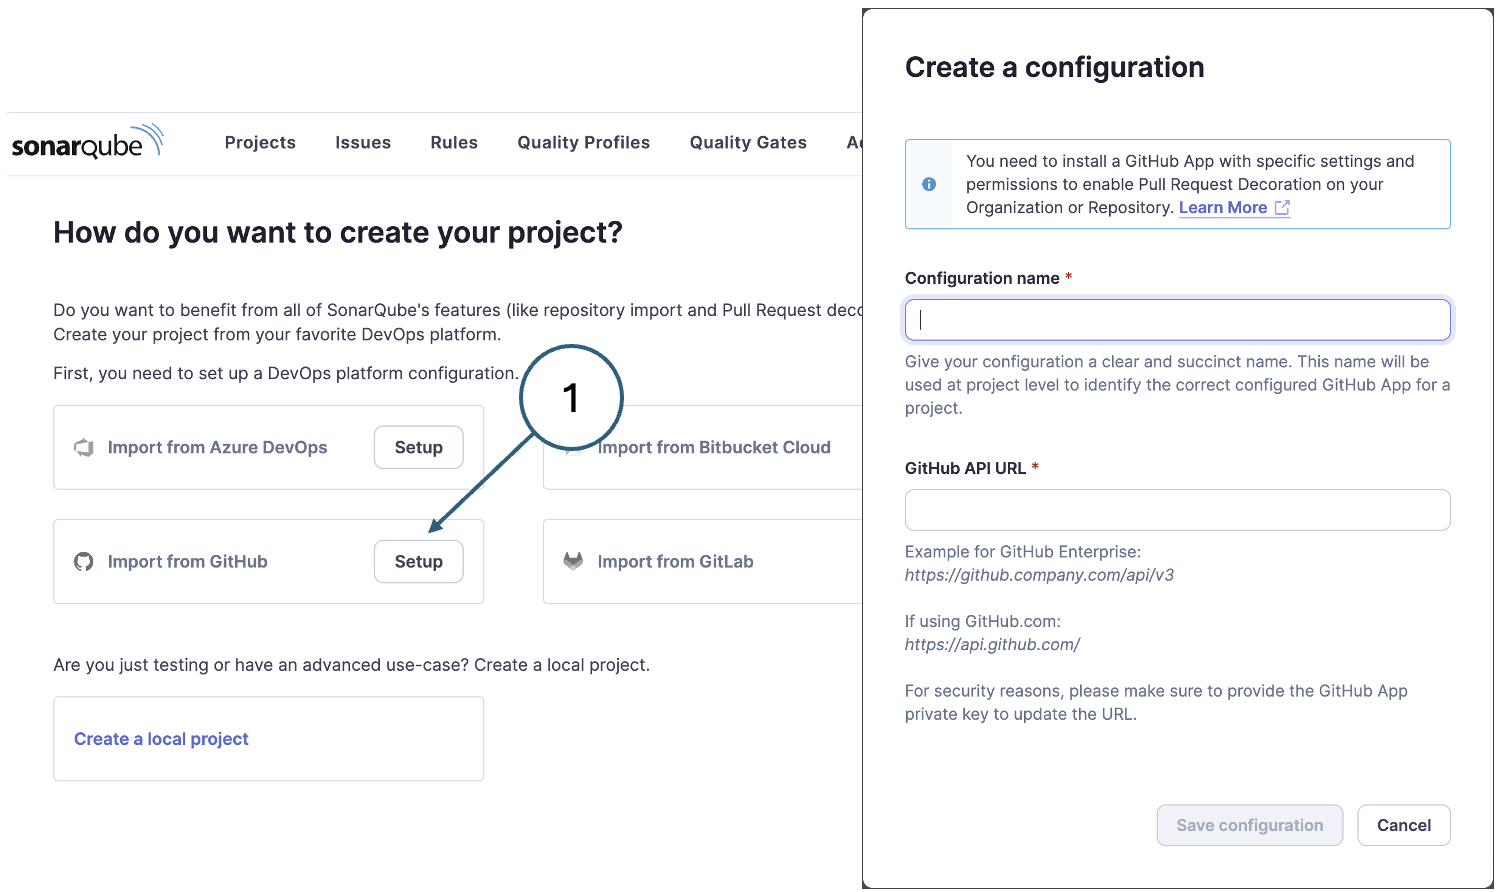
Fig. 1. Finding the settings button in GitHub
2. Configure GitHub integration
This step involves creating a GitHub app and installing it in your GitHub personal account. This is all done via the GitHub web interface.
Register a GitHub App
Follow the instructions provided by GitHub to register the SonarQube app. You will need the following values:
- App name: sonarqube-YOUR-GITHUB-USERNAME Note that the app name must be unique across GitHub, hence the use of your username as an element.
- Homepage URL: HTTP://localhost:9000
- Callback URL: HTTP://localhost:9000
- SonaQube provides guidance on the values that need to be set on the GitHub app. The main points are:
- Generate a client secret. This is a hexadecimal string that can be copied from the GitHub page once it has been generated.
- Generate a private key. This is in the form of a
*.pemfile which is automatically downloaded on creation. - Disable Webhooks.
- Set repository, organisation and account permissions carefully.
- Allow the app to be installed on any account.
Install the GitHub app in your personal account
Fig. 2 shows the page that is displayed once the app is created. To install it, click the button in the menu (1). Before doing so, note the other details that you will need to complete the SonarQube integration.
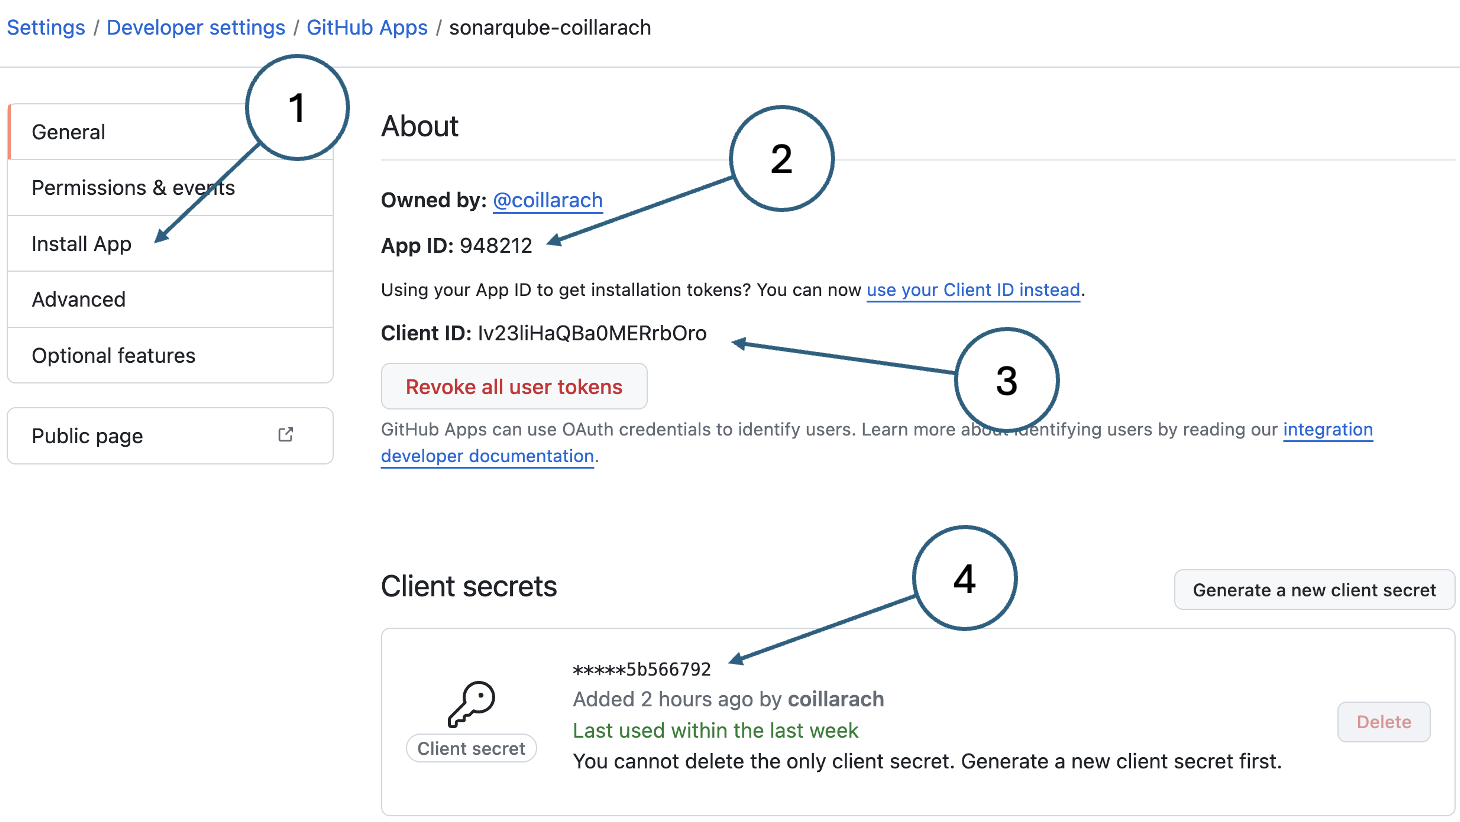
- Install button
- App id
- Client id
- Client secret. Note that you can only copy a client secret immediately after creation. If you did not copy it at the time, you will need to create a new one.
Complete the installation by following the prompts. Refer to the GitHub instructions if you have any difficulties.
3. Complete local configuration
In this step we will complete the SonarQube/GitHub integration using the information about the GitHub app you have just set up.
-
Going back to the SonarQube web page, complete the configuration creation dialog using the following values:
- Configuration name: Any descriptive name (e.g. sonarqube-github)
- GitHub API URL: https://api.github.com/
- GitHub App ID: The app id from the GitHub app details page
- Client ID: The client id from the GitHub app details page
- Client Secret: The client secret that you generated during GitHub app creation
- Private Key: The entire contents of the downloaded
*.pemfile
-
Specify the account and repository details.
On the project onboarding page, select the organisation and repository as shown in Fig. 3 and click Import

Fig. 3. GitHub project onboarding -
On the next page (Clean as you Code), select the option to use the global setting for the project baseline, and then click the Create Project button.
-
The next page gives you options for how to analyse your projects. Choose the Locally option.
-
On the next page, generate a project token as shown in Fig. 4.
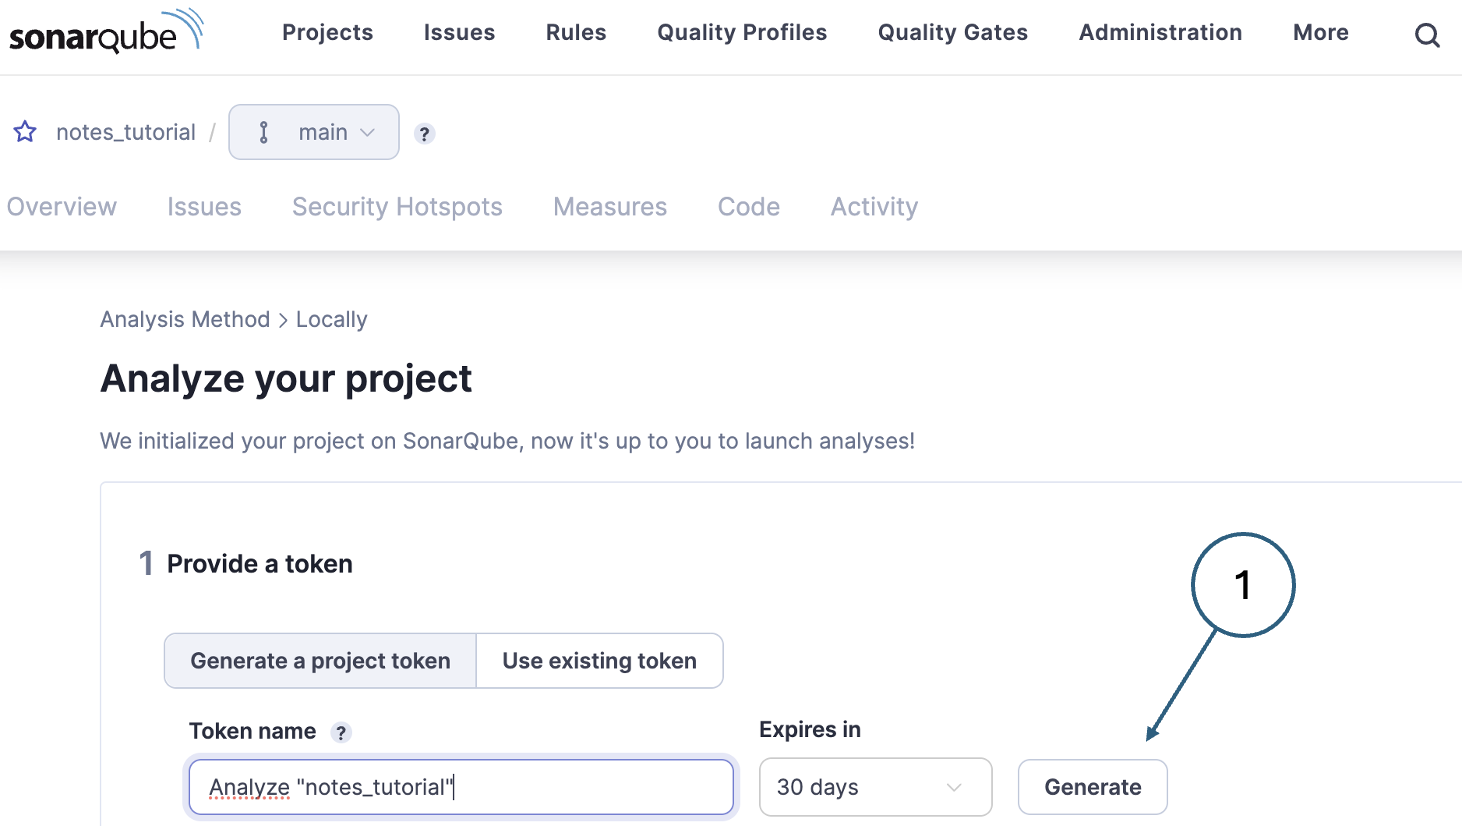
Fig. 4. Generating a project token The token is needed for communications between .NET and SonarQube. You will need to use the value as part of the CLI command so you should copy it and keep it somewhere. The SonarQube interface does not allow you to recover a token value at a later date. If you lose a token value, you can always generate a new one.
4. Install .NET scanner tool
The instructions for this section are provided in the SonarQube interface after selecting .NET Core as the project type. They are reiterated here for completeness. If you run into any kind of difficulty, please refer to the detailed instructions.
-
Install the scanner tool using the command below at a terminal prompt.
dotnet tool install –global dotnet-sonarscanner
-
Add the .NET tools directory to your PATH (if it is not already included).
This is similar to the process above for updating the PATH variable. Use the System Settings on Windows or edit the shell initialisation file on Mac or Linux. The directories to add are
- Windows:
%USERPROFILE%\\.dotnet\\tools - Mac or Linux:
~/.dotnet/tools
The tool installation command also tells you how to do this once it completes.
Remember that updating your shell initialisation only affects new shells. On Mac or Linux, you can add the new PATH configuration in the same way as before. This is also true for the terminal pane in VSCode. The simplest solution is to close it and start a new one.
- Windows:
5. Run an analysis
Before using SonarQube, there is one housekeeping task that needs to be done in order to maintain control over the GitHub repo. SonarQube creates a cache directory at the root of the solution which must be excluded from the codebase.
Edit the .gitignore file and add the following line:
1
.sonarqube
You are now ready to run an analysis for which you need both the project key and the project token. The SonarQube page allows to to copy and paste the commands that you need with these values already embedded as shown in Fig. 5. just after you have created the token. However, if you want to re-use the same token you should copy it and save it somewhere. The SonarQube interface does not allow you to recover a token value at a later date.

Three commands are needed to run the SonarQube analysis:
dotnet sonarscanner begin: This command includes the project key (1) and the project token (2). It essentially primes SonarQube to monitor the .NET build.dotnet buld: This is the standard .NET CLI command for building a project.dotnet sonarscanner end: This command includes the project key (3) and terminates the analysis. The results are then delivered to the web dashboard.
Copy each command in turn and paste it into a VSCode terminal.
Once the last command terminates, go to the SonarQube dashboard to see the results.
6. Examine the results
The first analysis page shown in the SonarQube web interface is a summary like the one shown in Fig. 6.
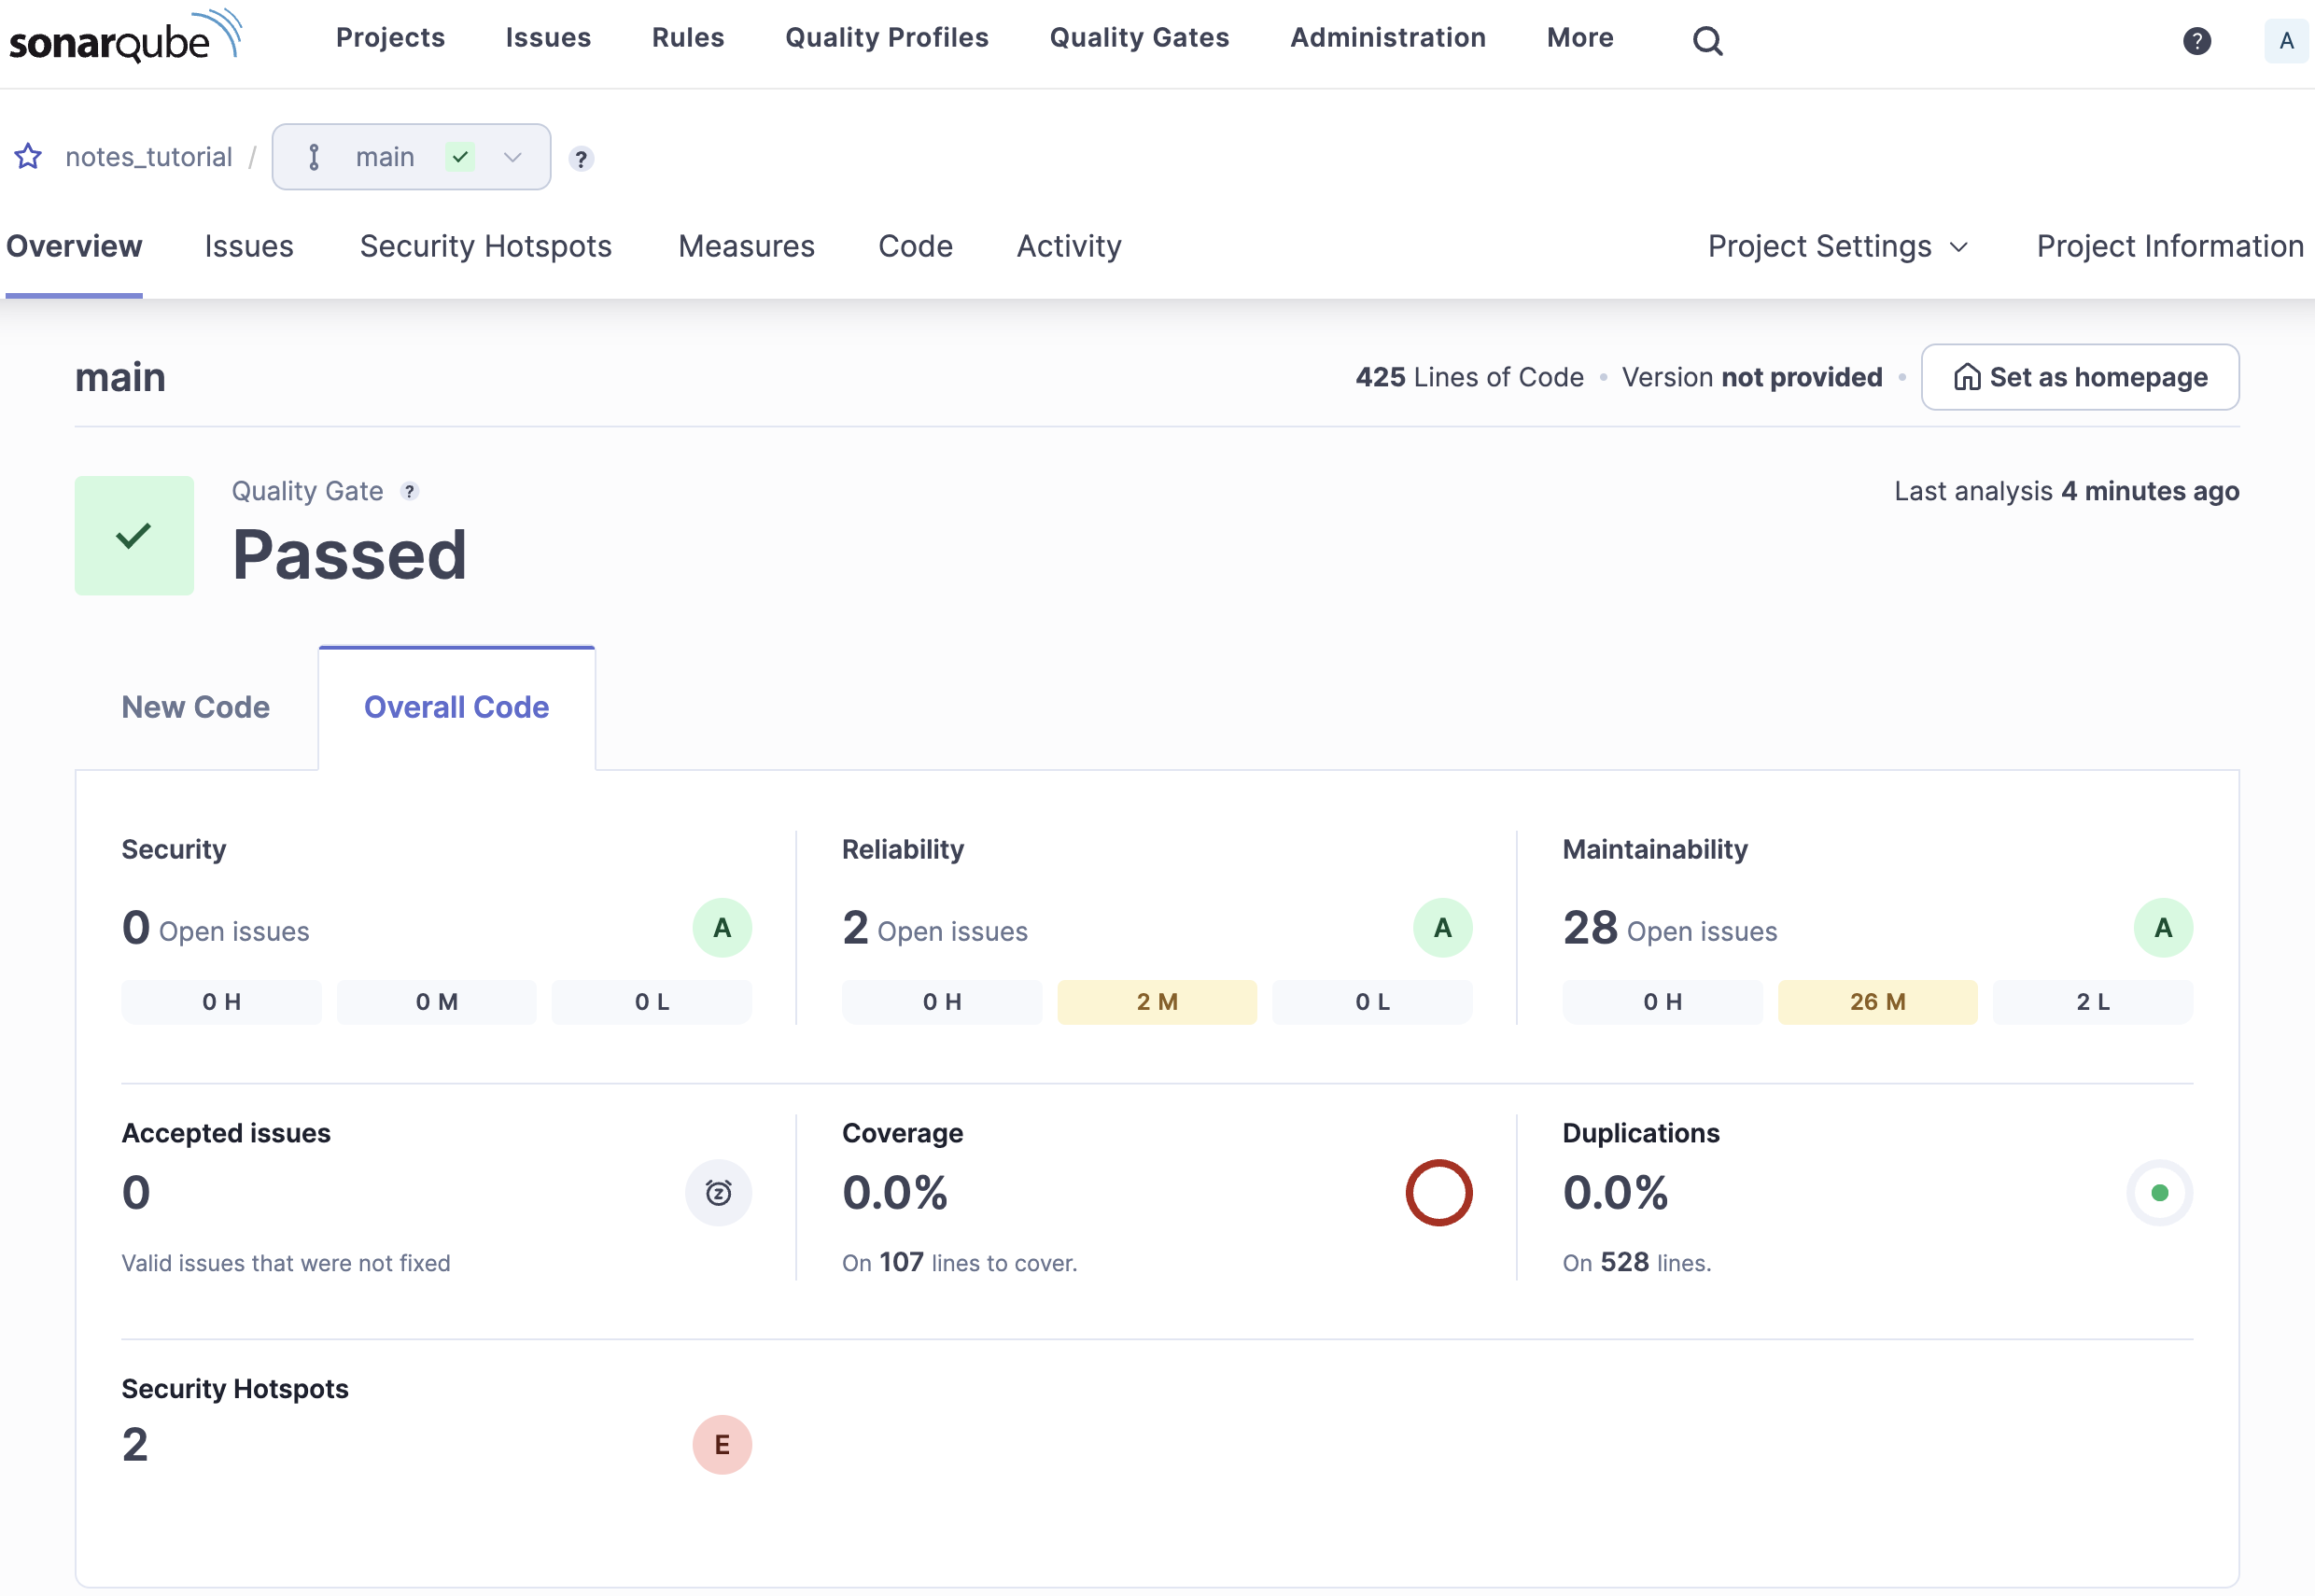
The example analysis shown here was run against the version of the Notes project that includes the migrations project. The summary shows that there are two potential reliability issues, 28 potential maintainability issues and zero test coverage. You can hover your mouse cursor over some of the elements on the page to learn more about what they mean.
Clicking the numerical value in each of the summary sections allows you to drill down to more detail. Doing that on the maintainability issues, for example, will display all 28 issues in a list. Clicking on one of the issues will let you drill down further to see the part of the codebase that contains the issue. The analysis also provides an explanation of why it is a problem and how to fix it.
Measures and metrics
As well as identifying specific lines of code that might indicate problems, SonarQube also calculates some high-level quality measures. You can see them by clicking the Measures item in the menu which will take you to a page like the one shown in Fig. 7.
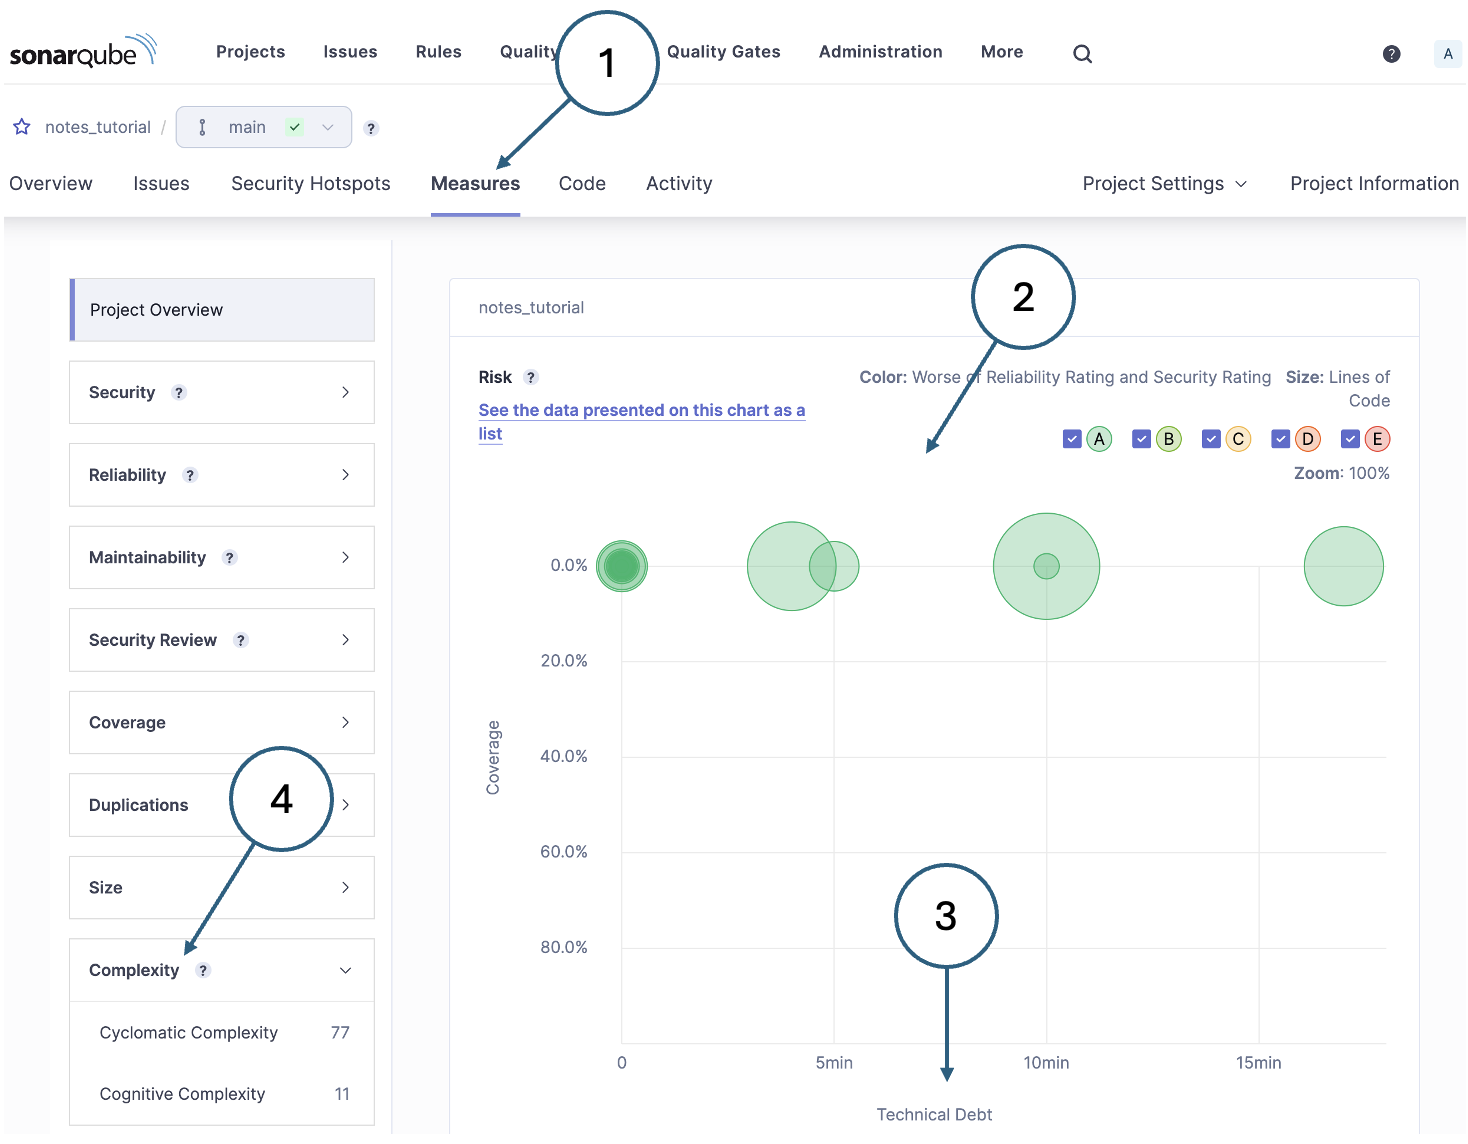
The overall health of the project is presented in graphical form (2) by default. This can be changed to a list display if needed, but the graphical version gives a good overall impression. Individual code files are shown as circles where the size of the circle indicates the size of the file in terms of lines of code. The colour depends on the number of serious issues identified in the file. In this case, they are all green indicating no major issues.
The vertical axis of the graph denotes test coverage - in the example, there are no tests and so all of the circular symbols apear at the top. The horizontal axis is technical debt (3) and its units are the estimated time required to fix the issues identified.
Most of the measures in the list are calculated by counting issues of particular kinds. However, the complexity measure (4) is calculated differently.
7. Stop SonarQube
SonarQube consumes very few resources where it is not active, and it is safe to leave it running. However, you may want to stop it just for tidiness. If so, use one of the following commands at a terminal prompt:
Windows:
1
StartSonar.bat stop
Mac or Linux:
1
sonar.sh stop
If you would like SonaQube to start automatically where you boot your computer, you can configure it as a service. Doing this is beyond the scope of this tutorial, but the SonarQube documentation provides clear instructions.